2024 Jan – Recent Crises, Taxes, and Inflation
2024 Jan – Recent Crises, Taxes, and Inflation
The stock market is a device to transfer money from the impatient to the patient.
— Warren Buffet
Markets
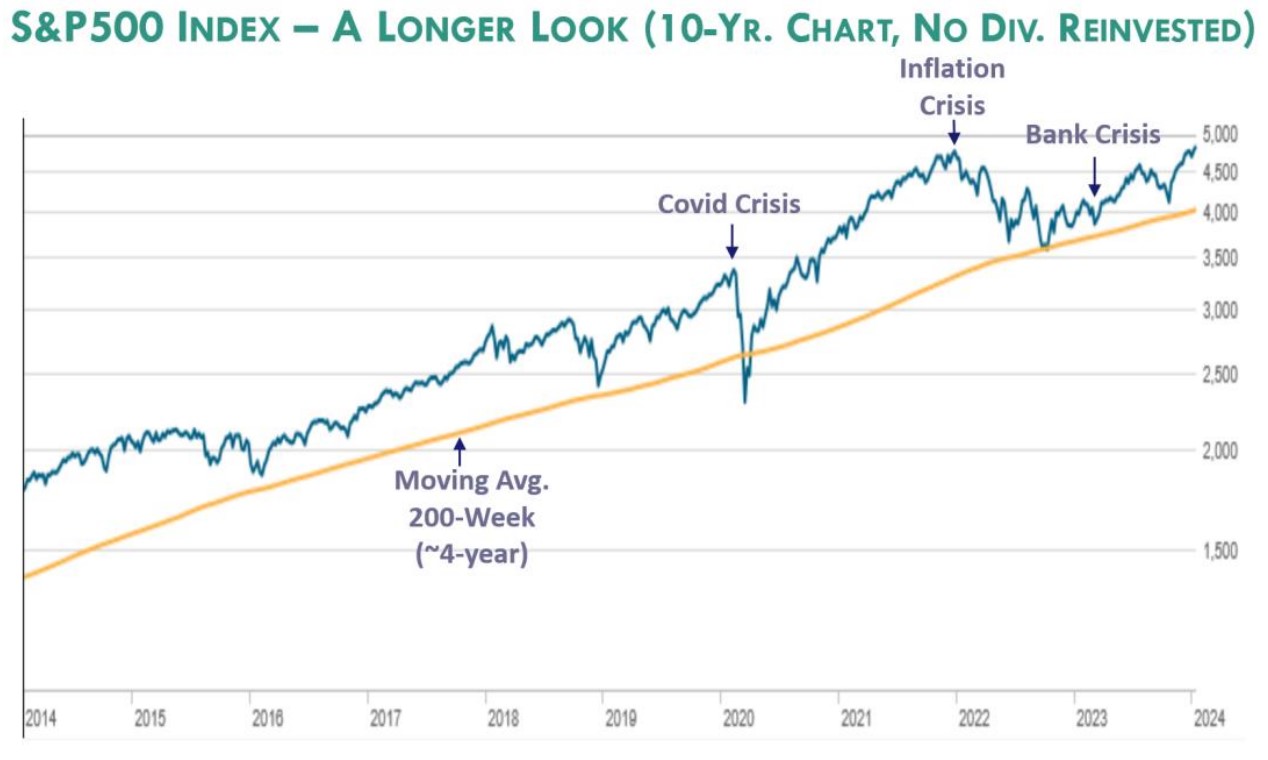
We’ve been on a wild (but typical) roller coaster ride for the last few years. For the record, the S&P500 index finished 2023 near a record high, a gain of more than 24% (not counting dividends). The figure below shows a long-term view of the market that’s not usually presented. It has a lot to tell us.

What’s shown is the S&P 500 index on a proportionate (log) scale over the last 10 years. Please look at the chart since 2020. We have had serial major crises, including the global Covid shutdown, inflation fighting with a record-breaking rate of rise in interest rates, and the Silicon Valley Bank failure when the Fed injected up to $2 trillion into the system that also sent the market up, and then had to withdraw it a few months later to limit inflation effects, which sent the market back down.
What’s interesting, though, is to look at the 200-week (~4-year) moving average of the market (orange line). (The 4-year moving average at each date is the average of the S&P 500 index over the previous 4 years; the popular 50-day moving average averages over just 50 days.) The 4-year moving average of the market increases at an amazingly steady rate (over 10% per year). All the volatility disappears! If we just step back, it’s easy to see the great rewards of simply staying in the market. The job of the owners of the leading companies is to protect and grow their (and our!) earnings, regardless of the current turmoil. All it takes to realize this is an investment time horizon that extends further out.
This simply underscores Warren Buffett’s quote at the top, that the rewards go to the patient. The alternative is the angst of trying to time when to get out of the market and then the even scarier decision of when to get back in. This requires perfect timing, twice! The other option of staying in a well-diversified portfolio pays well. But doing that is challenging with the environment in which we live, where we’re continually bombarded by the timing advice and fear spread by the financial media (which sadly will not change because that’s how they make their money).
Dry Powder?
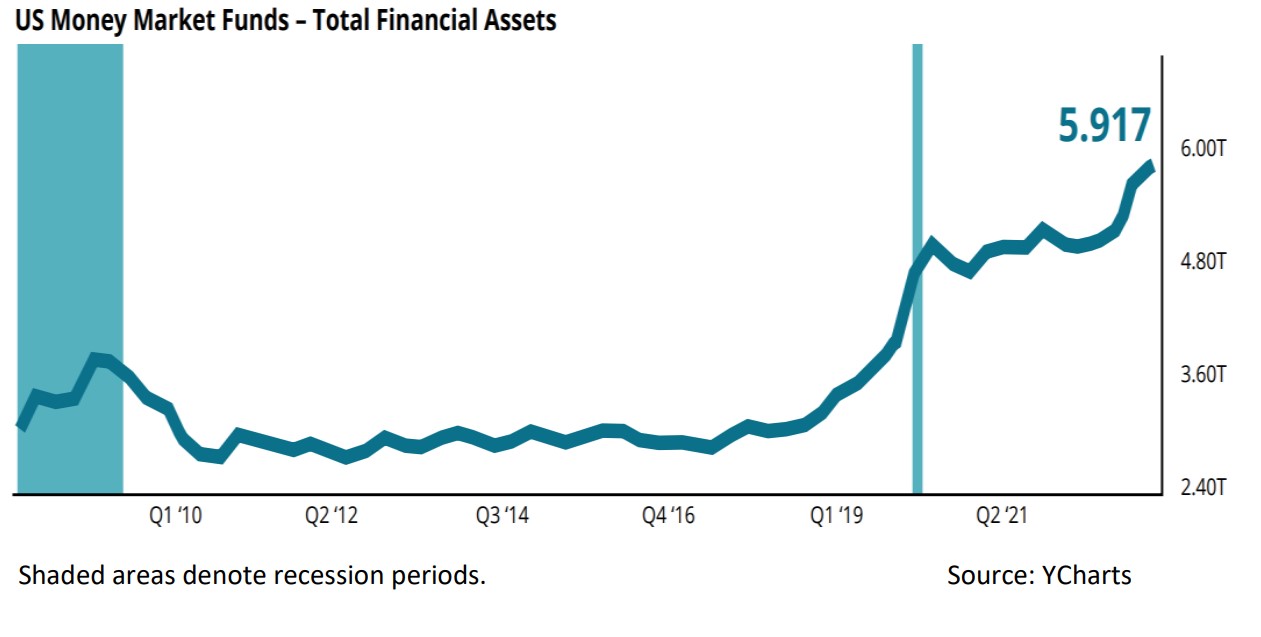
One more observation might also be useful. The chart below shows the rise in money (in trillions of dollars) that has flowed into short-term US money-market funds since Covid. In short, a lot of money is parked in cash now compared with the previous decade, potentially creating higher levels of “dry powder” for investing.

Taxes
With the new year also comes new tax rules – fortunately there’s not too many this year (in contrast to the last several years!).
- For emergencies, you can now take $1,000 out of your Traditional IRA before age 59.5 without the 10% early withdrawal penalty.
- You can also deposit up to $2,500 into a separate emergency account set up with your employer, which can be funded through after-tax payroll deductions. The employer holds it for you, and it could be useful presumably for those with difficulty saving into a personal account.
- Slight increases have gone into effect in 2024:
- The Social Security’s maximum wage is now $168,600.
- The 1040 standard deduction is $29,200 for married couples.
- The annual estate gift exemption is $18,000.
- The IRA and Roth IRA annual contribution limit is now $7,000, with an additional $1,000 catch-up for age 50 or older.
- The 401k annual employee contribution is $23,000, plus $7,500 catch-up for age 50 and older.
- Finally, and maybe the most expensive, businesses now must file a Beneficial Ownership Report. The due date for existing businesses to file is the end of 2024, while new businesses must register within 90 days with the Secretary of State. The penalty for failing to do this is a mere $10,000 per year.
This will be an interesting year with the upcoming presidential election. We will continue to monitor tax changes, especially as the Tax Cuts and Jobs Act provisions are currently scheduled to sunset at the end of 2025.
Inflation
The fight to stop inflation that was generated by the imbalance between supply and cash after Covid, has followed a path very similar to that during the last great inflation fight from 1979 to 1982. Then the Consumer Price index peaked at nearly 15%. This time, inflation peaked at about 9%. It’s now at about 3.4% and on a path to return to the target 2% level in the near future. As a cautionary note, though, there is a lot of anticipation that interest rates will also drop soon. For short-term rates, that’s certainly possible, but history shows that longer-term rates (e.g., 10yr. T-bills and mortgages) tend to be “sticky”. So, we wouldn’t be surprised to see them take longer to subside, like in the decade of the 80’s. However, as in the 80’s, there’s also a good possibility for a longer-term sustained equity market ahead.
We hope these thoughts and the accompanying information are useful!
Thank You, again!
We so appreciate your support for voting Nest Egg as the best financial advisor in North Tahoe/Truckee for the third consecutive year. We love what we do and greatly appreciate all of you!
With heartfelt best wishes for health and happiness in the New Year!
— Jack and Lisa

New Website! www.NestEggFA.com
TM Golden Window™ Tax Strategies is a trademark of Nest Egg Financial Advisors
© 2024 by Nest Egg Financial Advisors www.nesteggfa.com
