2024 Mid-Year – Earnings, Inflation, and the rewards of Thinking-Long Term
2024 Mid-Year – Earnings, Inflation, and the rewards of Thinking-Long Term
“The only thing new in the world is the history you don’t know.”
— Harry Truman
Keep Calm and Focus on Earnings
Last issue, we featured the ongoing series of crises that have occurred since the global Covid economic shutdown, sending trillions of dollars in and out of the market at the worst times for the average investor. For your investments, we invite you to tune out the noise (inflation fears, debt, Nvidia, rate cuts, the election) and instead focus on what we own (well-diversified portfolios of exceptional businesses) and the true driver of their value – earnings and dividends. If we step back and look at the 4-year moving average of the S&P500 index shown in the link above, the gyrations of the market disappear simply looking longer-term.
Today it’s the same story. Short-term angst over current media crises is pervasive. However, earnings projections by Bloomberg for the companies in the S&P500 show considerable growth ahead: 11.3% in 2024 and 14.4% in 2025. Expect volatility, yes. But the steady hill of earnings is what drives stock prices over the long term and is what funds our goals.
Some Perspective on Inflation
One of the great concerns at present is inflation and the rise in interest rates to stop it. To provide some context to the current media narrative, remember that inflation and deflation cycles are always caused by the imbalance between the amount of spending versus the availability of things to buy. The media has focused almost exclusively on the increase in the money supply that was injected to support the economy through the Covid pandemic. Yes, too much money was injected (a deflationary depression would have been far worse to recover from), but again it was the imbalance between money and supplies, not money alone.
During the Covid shutdown, supply chains dried up globally. It takes several years to restart a world economy. Inflation was inevitably baked in the cake coming out of the shutdown as people started spending much more rapidly than the recovery rate of available goods and services.
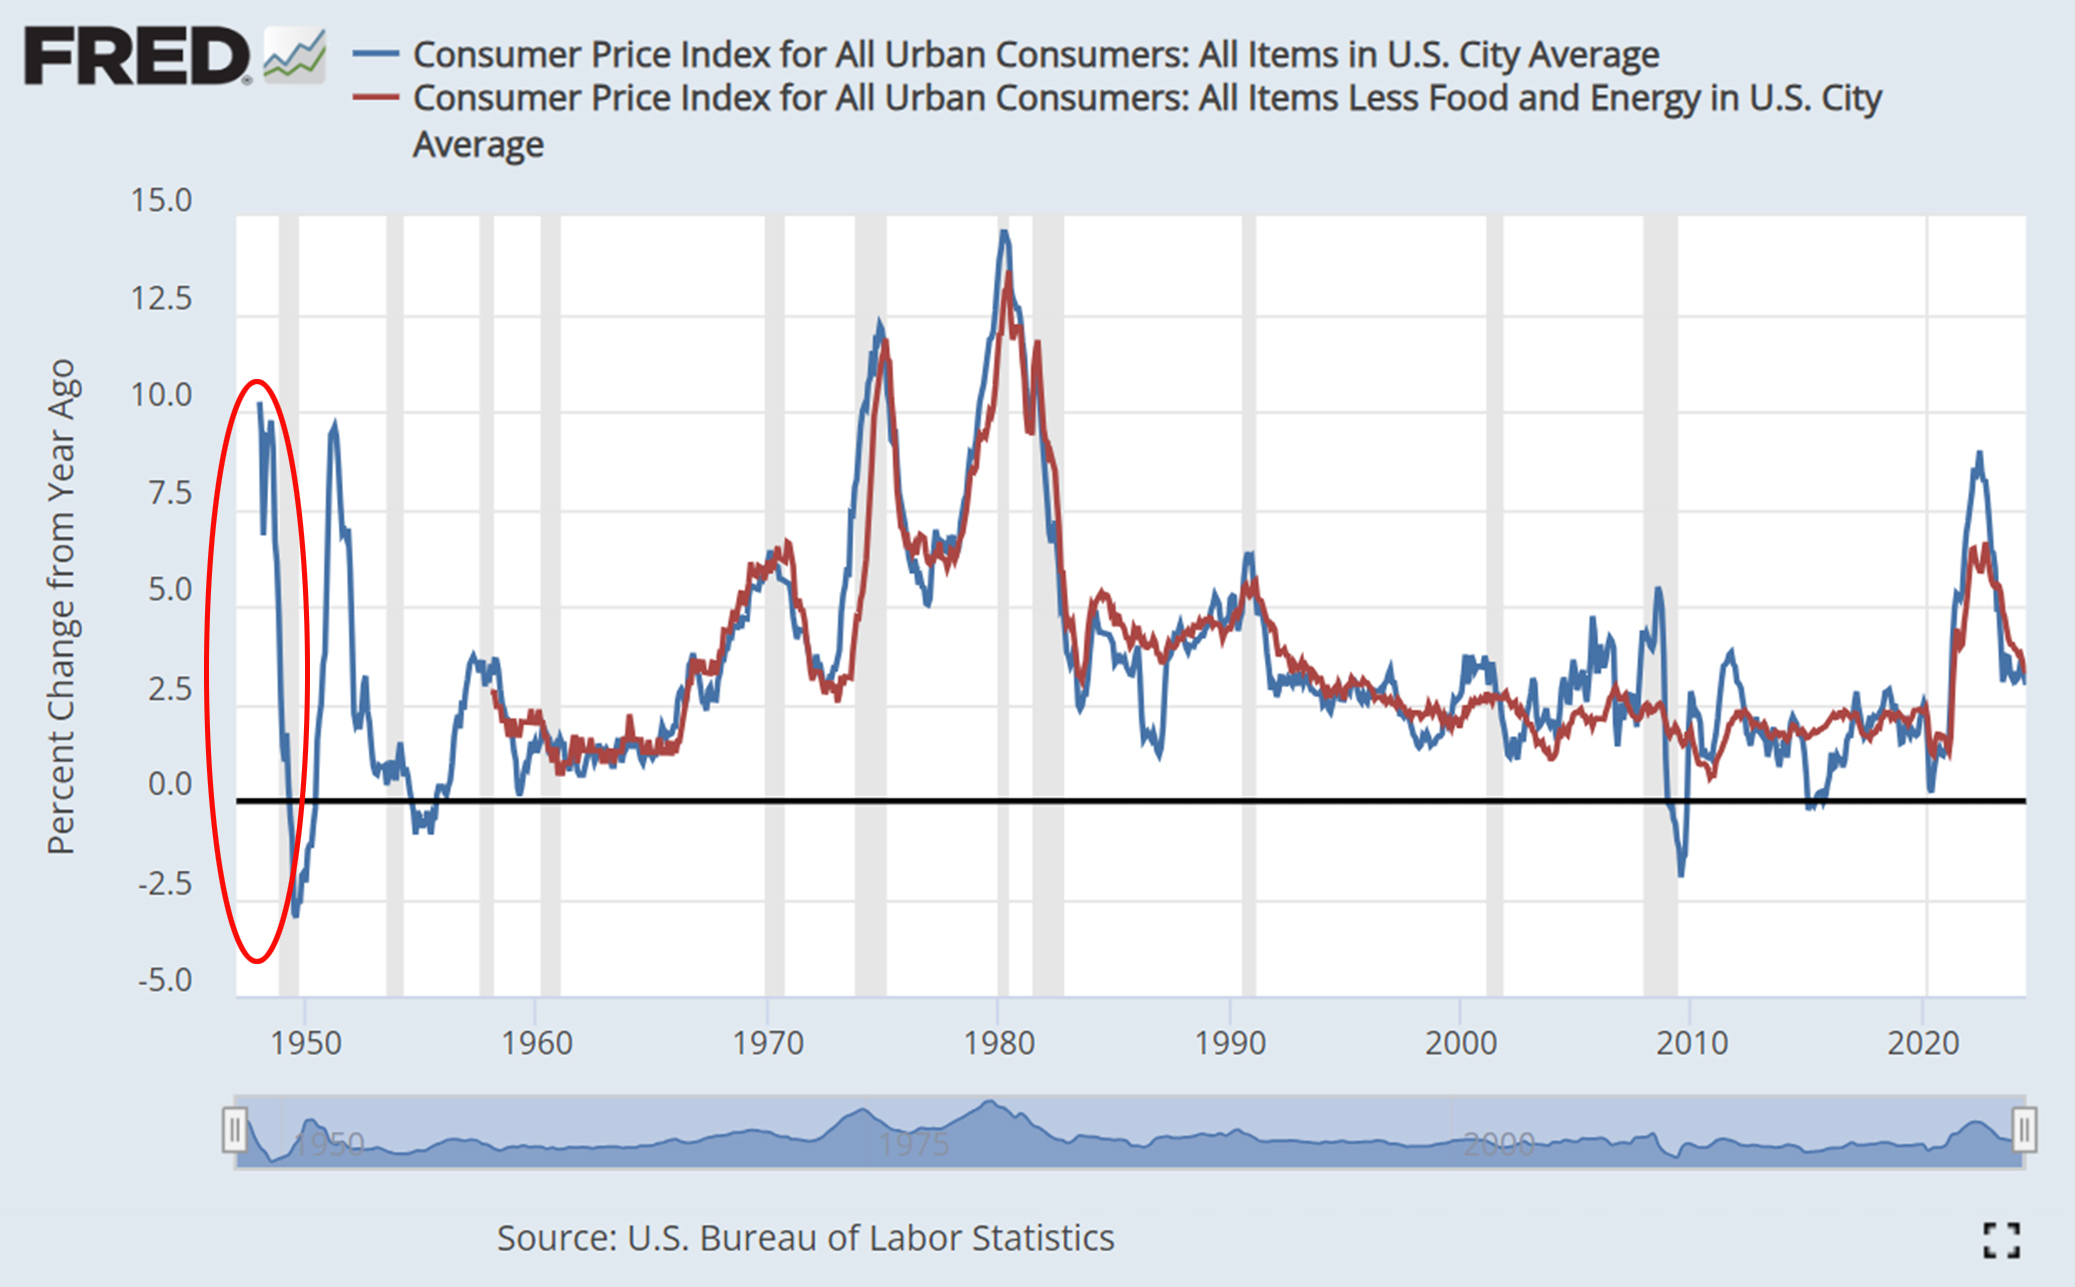
For a historical example of the same type of global supply shortages, look back to what happened with inflation coming out World War II when the world struggled to shift from a war economy to restart the domestic economy. In the chart below, we see the considerable inflation spike that occurred in the late 40’s (circled in red) as the domestic economy struggled to reopen to keep pace with the rapid rise in spending when WWII ended. We’ve seen this before. (The second spike in the chart in the early 1950s was generated by the start of the Korean war as households rushed to purchase goods, fresh with memories of WWII rationing and supply shortages.)
It’s noteworthy that the “The only thing new in the world…” quote above was spoken by none other than the president at the time.
Inflation after WWII World Shutdown of Domestic Supply Chains

FOOTNOTE: For those of us old enough to remember, the hyperinflation of the 80’s in the middle of this chart had a different source, but again an imbalance. It stemmed from the accumulated political pressure put on the Fed over time, starting in the mid-1960s, to keep unemployment low with a money supply increasing at too high a long-term rate. The inflation this generated came to a head in the mid 70’s when OPEC created the oil and gas shortages. The heavy lifting to stop the inflation was provided in 1979 when Paul Volker was appointed as Fed head by Carter and, most importantly, was given the political independence to raise interest rates to unprecedented levels to shut it down (Fed Funds rates > 20%!). [Reference]
General Principles
Our job is to help our clients not lose long-term perspective amid the flood of short-term headlines. We are goal-focused, plan-driven, long-term equity and tax-saving investors. Our portfolios and tax plans are derived from and driven by your most cherished lifetime goals, not from any current view of the economy or the markets.
With well-diversified portfolios, integrated with wealth and tax planning, we are prepared to ride out the equity market’s frequent, often significant, but historically always temporary, declines. Even during such trying episodes, our ongoing dividend reinvestments and strategic bond rebalancing buy lower-priced shares, setting up additional powerful compounded returns.
Thank You!
We hope these thoughts and the accompanying information are useful!
We are so grateful for your enthusiastic support. We love what we do and greatly appreciate all of you!
With heartfelt best wishes for your health and happiness!
— Jack and Lisa

New Website! www.NestEggFA.com
TM Golden Window™ Tax Strategies is a trademark of Nest Egg Financial Advisors
© 2024 by Nest Egg Financial Advisors www.nesteggfa.com
