Deeper Look DFA vs Vanguard
Comparison after deduction of all fund expenses. From the beginning of the “Lost Decade”.
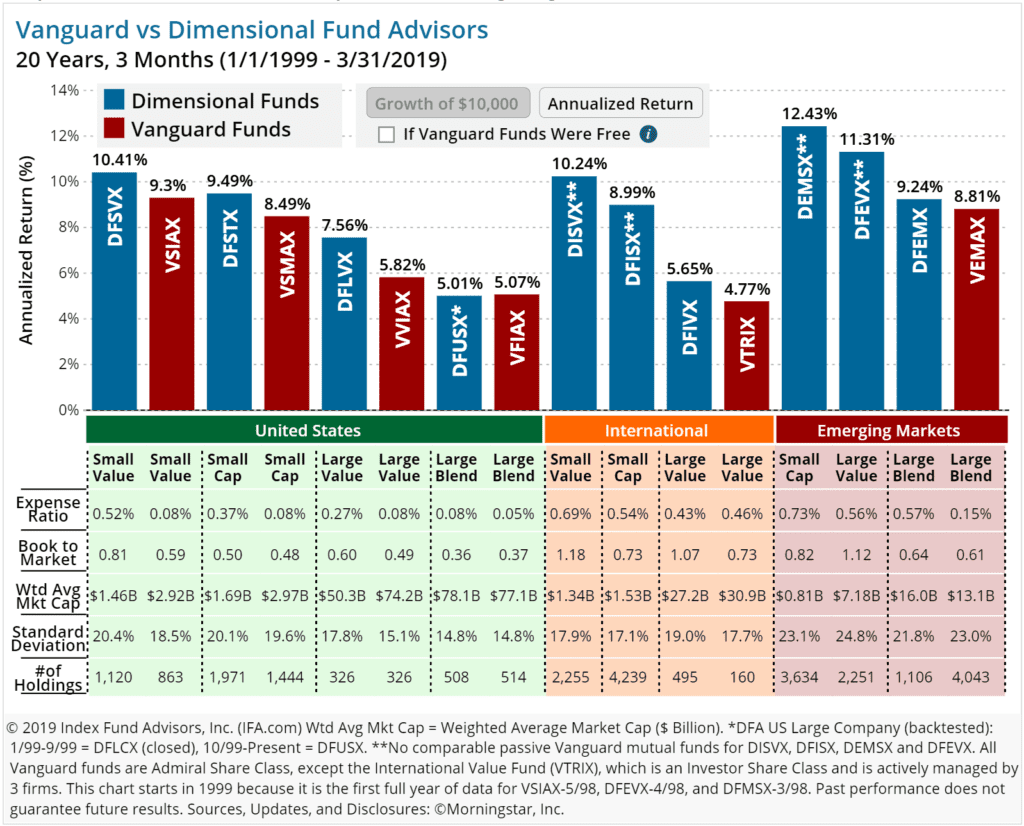
As you can see, in almost every asset class Dimensional has outperformed Vanguard, even with higher expense ratios. Why?
In the table below the bar chart, there are 5 different categories that include Book-to-Market (a value metric), Weighted Average Market Capitalization and Standard Deviation. The higher the Book-to-Market ratio, the more the fund is exposed to the value factor. Weighted Average Market Capitalization is a measure of exposure to the size factor. The smaller this number, the greater the exposure to the size factor (small and micro cap stocks). You can see that Dimensional consistently had a higher Book-to-Market Ratio and a smaller Weighted Average Market Capitalization. In other words, they have been better at targeting the known dimensions of expected stock returns. This has led to their outperformance against Vanguard while still maintaining robust diversification (# of holdings).
[https://www.ifa.com/articles/dimensional_fund_advisors_deeper_look_performance]